You're standing in your living room while a technician clicks a fan into the front door, closes the exterior openings, and waits for the house to settle under pressure. A few minutes later, you get a one-page report with numbers that look technical but are really just a map of where your home is letting outside air sneak in. If you live in South Florida, that map matters for a different reason than in a dry climate, because air leakage doesn't just waste cooling, it drags humidity into the house and makes every hot afternoon harder on your AC.
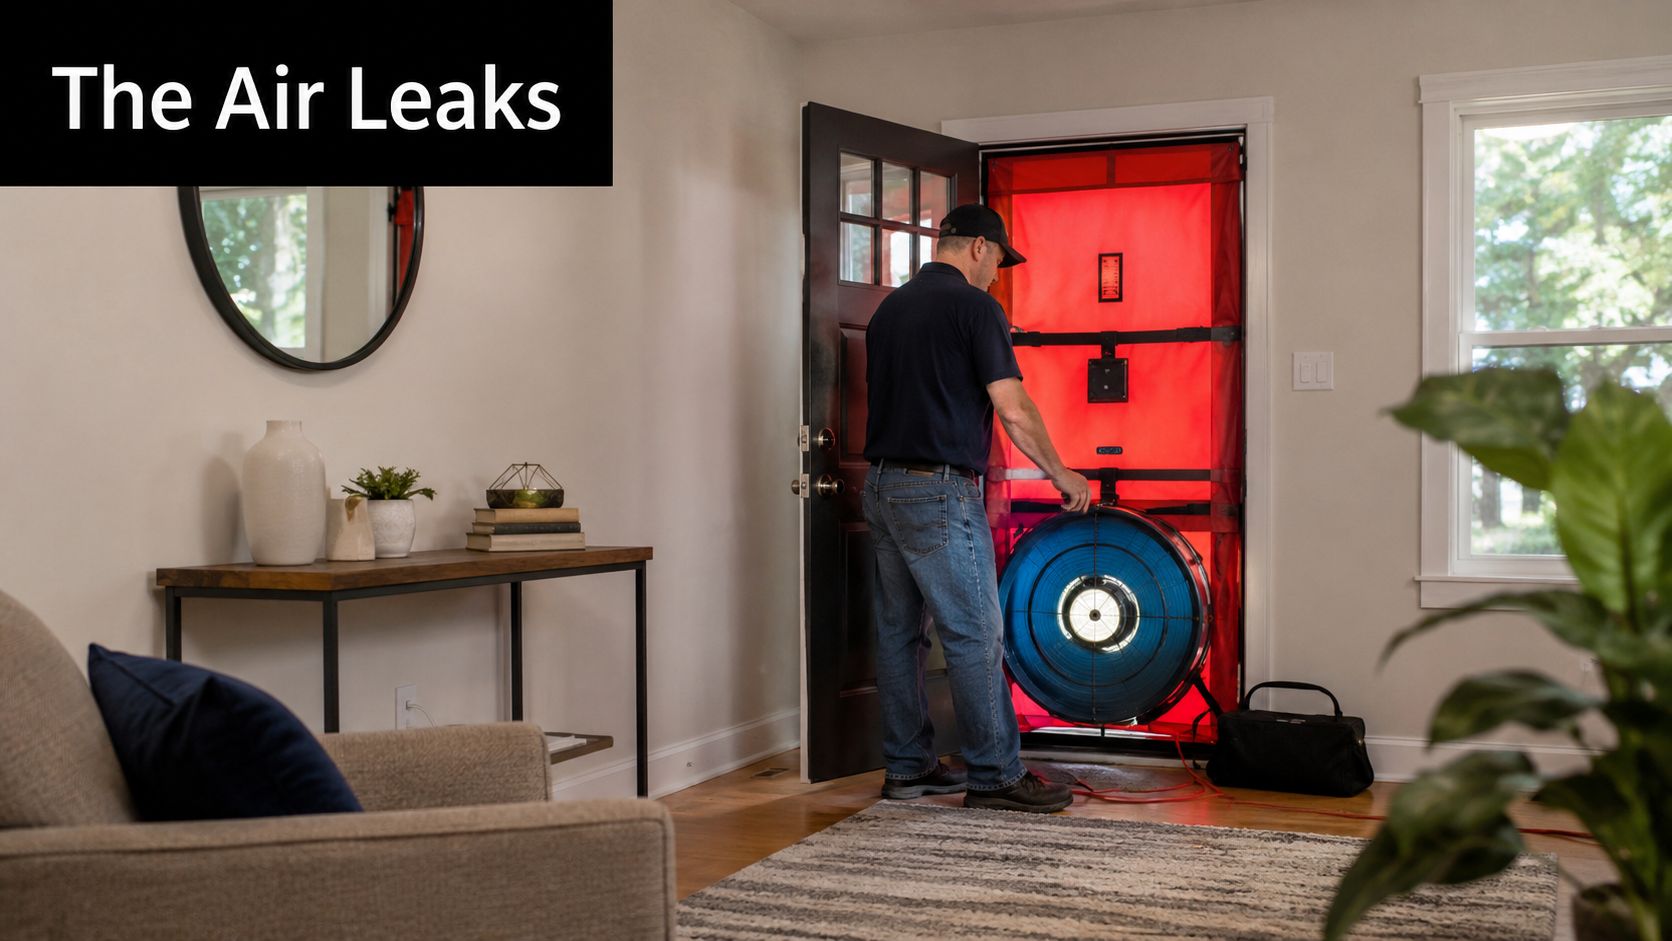
If you're trying to understand a report after a visit from an auditor, start with the big picture first. A blower door test is a whole-house envelope test, not a duct test, and it answers a simple question, how leaky is the shell of the building when it's held at a standard pressure? For a quick primer on the setup itself, what a blower door test is helps connect the fan in the doorway to the score on the page.
The technician doesn't care about one crack or one window at first. The fan is used to depressurize the home so outdoor air gets pulled through the weak points in the envelope, and those leaks become measurable instead of hidden. That's why the test is so useful, it turns a vague feeling of “this house is drafty” into a building-wide score you can compare, retest, and improve.
A blower door result is not a comfort rating by room, and it's not a duct leakage number. It describes how much air the entire building envelope lets through when the house is held at a standard test pressure. That's why a home can feel cool in one room and sticky in another, yet still produce a single envelope score that tells you something about the structure as a whole.
The useful analogy is a balloon with pinholes. You may not see the holes, but once pressure changes, the leaks show themselves. In a home, the same thing happens at attic bypasses, framing joints, and penetrations that connect conditioned rooms to outdoors or to unconditioned spaces.
Practical rule: if the test report is about blower door test results, it's about the envelope, not the HVAC system itself.
That distinction matters for homeowners because it changes the next move. Duct sealing, insulation upgrades, and air sealing all affect performance, but this test is the starting point for deciding whether the shell itself needs work before you spend money on other fixes. In South Florida, that often means checking whether the home is being asked to cool and dehumidify air that keeps leaking in from outside.
A good report should also point you toward the next conversation, whether that's code compliance on new construction, a weatherization plan, or targeted sealing before a spray foam retrofit. The number alone isn't the whole story, but it's the gateway to every decision that follows.
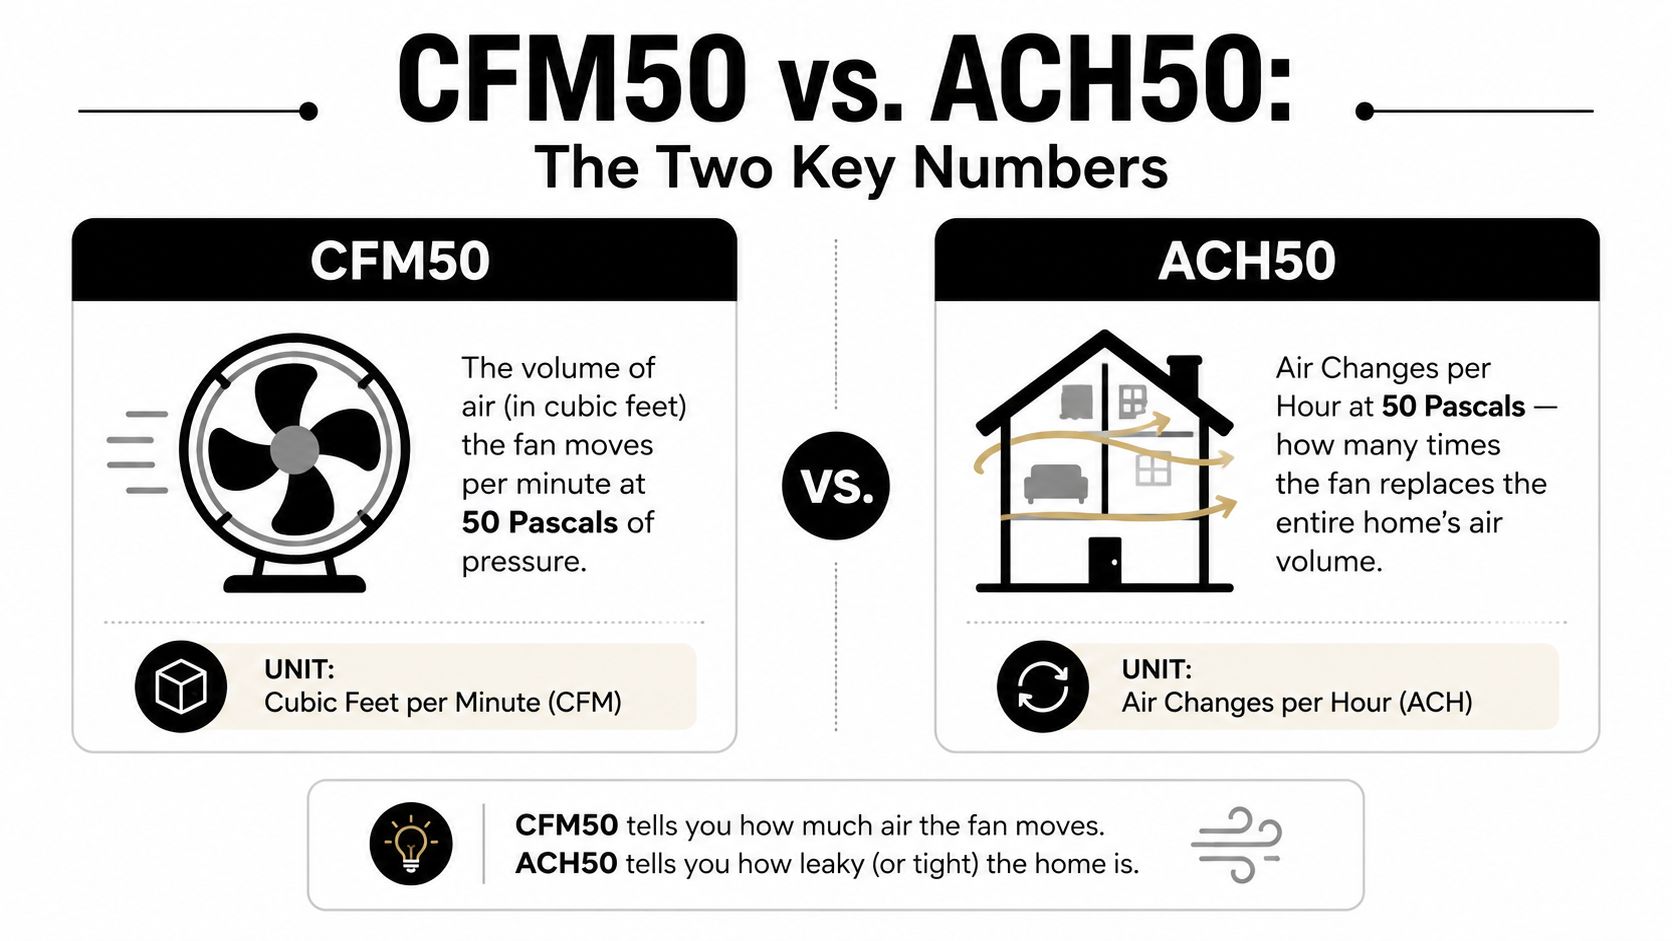
The two numbers that matter most on a report are CFM50 and ACH50. CFM50 is the amount of air, measured in cubic feet per minute, the fan has to move to hold the house at 50 pascals of pressure difference. ACH50 uses that same leakage number and divides it by the home's volume, so a small house and a large house can be compared without size distorting the result. Many new-house standards use a ceiling of 3 ACH50 in climate zones 3–8 while climate zones 1–2 often allow 5 ACH50 or less, according to Energy Conservatory guidance on blower door test results.

The 50 Pa test pressure gives the house a controlled artificial wind. It is strong enough to make leakage measurable, yet standardized enough that one home can be compared with another. Without that fixed pressure, a breezy test day or a different fan setting could make two houses look tighter or leakier than they really are.
CFM50 is the raw fan reading. ACH50 is the same leakage adjusted for the size of the building. That difference matters in South Florida, because a larger home may post a higher CFM50 and still be fairly tight, while a smaller home can show a modest CFM50 and still miss a code target if the leakage is large relative to the home's volume. The Oregon blower door guidance makes that distinction clear, and it is why performance programs usually focus on ACH50 when they judge airtightness.
CFM50 shows the strength of the leak, and ACH50 shows that leak in relation to the size of the container. If your report only lists one of them, ask for the other. Homeowners often focus on the raw fan number because it feels concrete, but the normalized number usually says more about comfort, moisture control, and whether the house is asking the air conditioner to keep up with outside air that keeps sneaking in.
A quick benchmark helps. In code-driven projects, 3 ACH50 is a common target, while 0.6 ACH50 is a much stricter Passive House level. You do not need to memorize every standard, just remember that lower means tighter, and the number that matters most for comparison is the one adjusted for volume.
A useful report usually starts with the building volume, then lists the test pressure, the measured airflow, and the derived CFM50 and ACH50. If you're looking at a South Florida home, don't let the paperwork overwhelm you. The important part is understanding which line tells you how much air the fan needed, and which line tells you how serious that leakage is for this particular house.
The test setup should show that the fan was installed in a doorway or similar entry point, with the building prepared the same way throughout the test. The technician will take pressure and airflow readings, then use the fan curve to estimate the leakage at the standardized pressure. That's why the report often includes more than one reading point, because the final number is usually built from a set of measurements rather than a single guess.
Here's the part homeowners can use:
| Report item | What it means |
|---|---|
| Building volume | The size of the air space being tested |
| Fan setting or ring | The equipment range used to hold pressure |
| Baseline pressure | The house pressure before the fan started |
| CFM50 | Raw airflow needed at 50 Pa |
| ACH50 | Leakage adjusted for house volume |
That classification line at the bottom matters too. Industry guidance commonly labels airflow below 1,500 CFM50 as tight, 1,500 to 4,000 CFM50 as moderate, and above 4,000 CFM50 as leaky. Very leaky older two-story wood-framed homes often test around 4,000 to 8,000 CFM50, while modern airtight homes may come in around 600 to 1,000 CFM50, according to the same Energy Conservatory guidance.
Practical rule: if a big house and a small house have the same CFM50, the smaller one is usually the leakier of the two once you look at ACH50.
That's why a homeowner shouldn't stop at the raw fan number. The report is really a translation tool, from fan behavior to building performance. If your auditor gives you both numbers, you can tell whether the home is roughly in a tight, moderate, or leaky range before any sealing work begins.
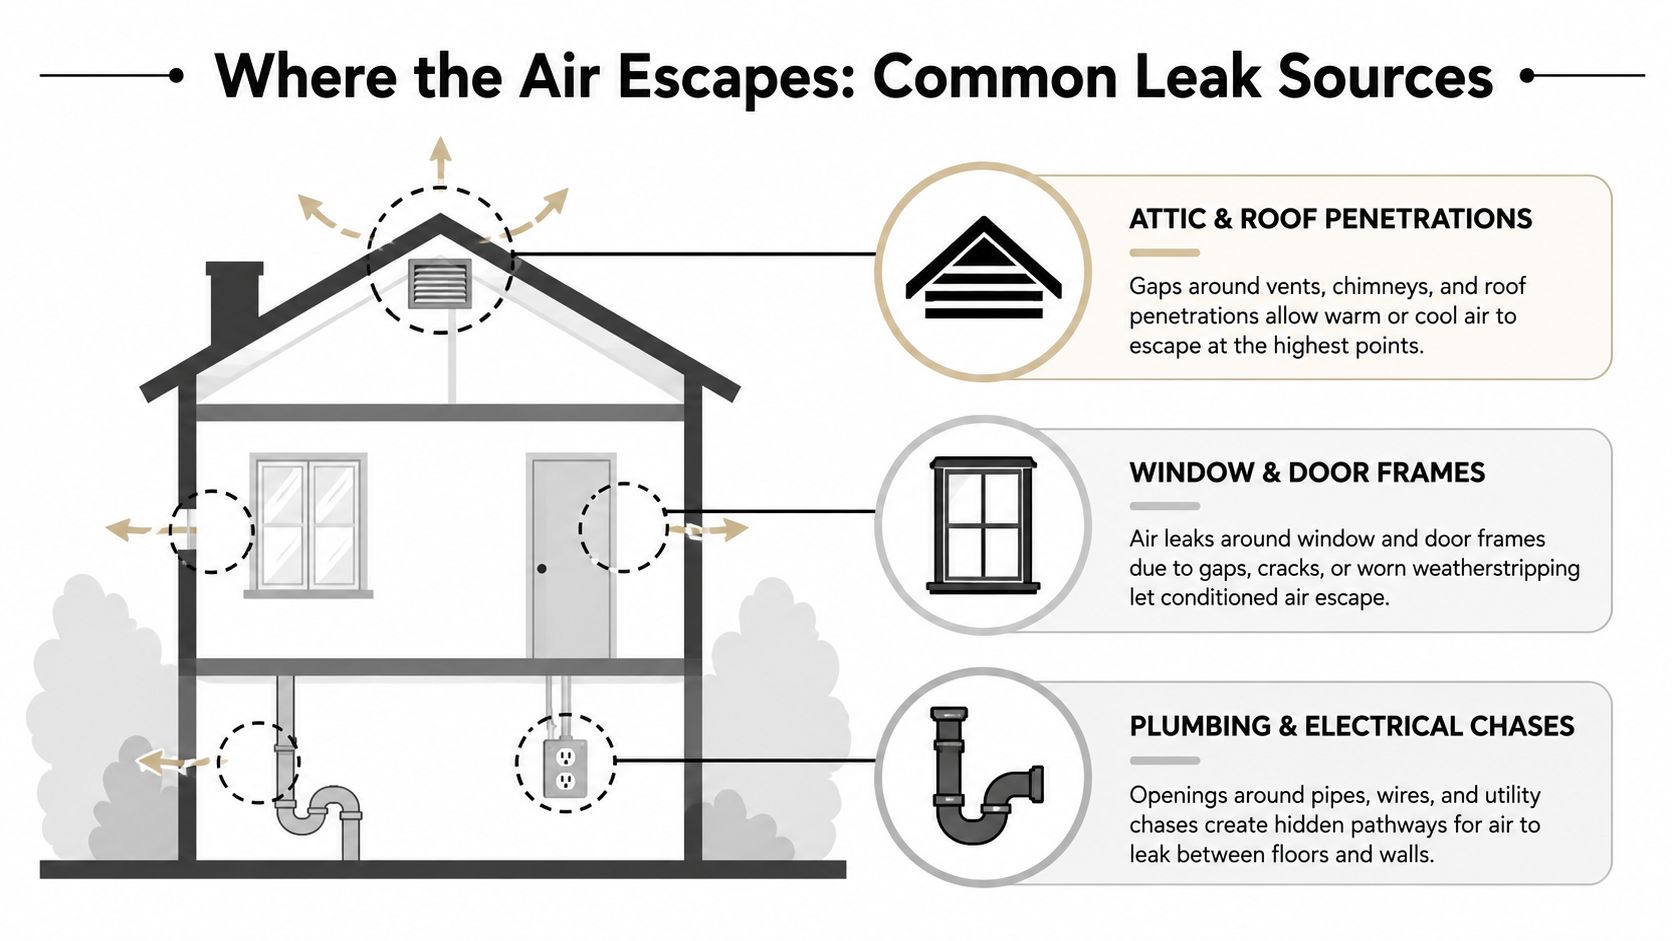
Some homes look fine until the fan turns on, then the same hidden weak spots show up everywhere. In South Florida, the usual culprits are attic hatches, recessed lights, wall and ceiling penetrations, rim joists, and duct boots in unconditioned space. A test doesn't create these leaks, it makes them easier to find.
Attic hatches and pull-down stairs often leak because they're movable, and movable parts are hard to seal perfectly. Recessed can lights can act like small chimneys if they weren't built to be airtight. Plumbing and electrical penetrations are tiny by themselves, but they add up fast when there are many of them. Rim joists and top plates can be even more important because they sit near the edges of the building where pressure differences are strong.
A good clue is visible daylight, dirty insulation around fixtures, or a faint stream of air when you run your hand near a suspect spot on a windy day. Duct boots in unconditioned attics can also show up during depressurization because the test pulls on every weakness between the conditioned space and the outdoors. For a broader diagnostic pass, thermal imaging inspection is often used alongside the blower door to show where temperature patterns line up with leakage paths.
If you want a practical consumer reference for a related area, the garage side of the house often deserves attention too. Garage door draft prevention tips can help homeowners reduce a common source of hot, humid air intrusion that shows up around attached garages and service entries.
The point isn't that every leak has the same impact. It's that the report becomes actionable only when you connect the score to physical places in the house. Once you know where the air is getting through, sealing stops being a guessing game and starts being a targeted repair list.
South Florida puts a different stress on a leaky home than a dry climate does. In Jupiter, Palm Beach Gardens, West Palm Beach, Wellington, and Stuart, outdoor humidity is often high enough that every leak carries a moisture burden with it, not just a temperature burden. That means the same hole in the envelope can contribute to sticky rooms, longer AC cycles, and more pressure on the building assembly to handle humidity.
When humid outside air enters a cooler home, it doesn't stay neutral. That moisture has to go somewhere, and it usually condenses on the first cool surface it hits or lingers inside cavities that aren't designed to handle it. That's why a blower door score in South Florida has to be read as a moisture-control number as much as an energy number.
Commercial and multifamily testing guidance also reminds us that the test has to be interpreted with care, especially when the building isn't a simple single-family house. Whole-building tests should include a calculated uncertainty interval, and guarded versus unguarded methods can shift results by hundreds of CFM50 and by roughly 7% to 11% in example projects, according to Energy Conservatory applications guidance. That's another reason local conditions matter, because the score is only useful when you know exactly how it was obtained.
In a humid climate, a home that leaks less air is usually easier to keep dry, quieter to live in, and less punishing for the cooling system.
If you're trying to reduce utility bills in an older Florida home, the broader efficiency playbook still starts with the envelope. SuperiorPRO's efficiency tips are useful as a general reference point for homeowners who want to compare sealing with other common upgrades.
The local takeaway is simple. Airtightness isn't a niche building-science detail here, it's part of humidity management. Tightening the envelope gives your HVAC system a better chance to control both temperature and moisture, which is why South Florida homes often feel more comfortable after the leaks are addressed.
Once you know where the leaks are, the next question is what should stop them. Spray foam, caulk, foam board, and air sealing tapes all have a place, but they do different jobs. A narrow crack near a pipe needs a different fix than a wide joint at an attic transition, and a major leak path needs a material that can hold up after the test van leaves.
Open-cell spray foam is often used where air sealing and insulation need to work together, especially in attic transitions and wall cavities that do not need the extra moisture resistance of a denser foam. Closed-cell spray foam creates a stiffer air barrier and offers more moisture resistance, which helps in spots that need more durability. For homeowners comparing those tradeoffs, a deeper look at spray foam tradeoffs is a useful companion read before choosing a retrofit approach.
Caulk and low-expansion foam fit smaller penetrations, not broad surfaces. Rigid foam board with tape can work well across a flat area, but the seams have to be detailed carefully or the joint becomes the weak point. The right choice depends on the leak source, not on a one-size-fits-all promise.
| Sealing approach | Best use | Practical note |
|---|---|---|
| Open-cell spray foam | Attic chases, wall cavities | Air seals and insulates in one step |
| Closed-cell spray foam | Rim joists, moisture-sensitive areas | Denser barrier with stronger moisture resistance |
| Caulk and low-expansion foam | Small gaps, penetrations, trim joints | Good for targeted detailing |
| Rigid foam board plus tape | Larger flat sections | Needs careful seams and fastening |
Weatherization work on leaky homes can reduce CFM50 by 40% to 50%, and research on energy-rated homes found normalized leakage values averaging 30% lower than non-rated homes, according to NASCSP-linked blower door research. That matters because the blower door test is not only pointing out where air is escaping, it gives you a way to check whether the repair changed the house.
For South Florida homes, the pattern is easy to see. Spray foam often handles the larger leak paths, while smaller sealants clean up the remaining gaps, and that combination can help the home hold cooling and moisture control more effectively. Airtight Spray Foam Insulation is one option for homeowners and builders who want the sealing work matched to the test findings instead of guessed at by eye.
A credible before-and-after comparison starts with the same protocol both times. The home should be prepared consistently, the test setup should be documented, and the auditor should note anything that might affect the numbers, such as adjacent spaces, combustion appliances, or unusual pressure conditions. If the setup changes, the comparison gets muddy fast.
Ask whether the report will include the test pressure, the measured fan flow, and any uncertainty detail. ASTM E1827 calls for installing the blower door in an entry with minimal airflow obstruction and recording both pressure and airflow during replicate measurements, and tests in the 40–60 Pa range generally improve accuracy and reproducibility, according to the WSU-linked ASTM guidance summary. That's exactly the kind of detail that makes a before-and-after result trustworthy instead of merely convenient.
A clean workflow looks like this:
Morning scheduling helps in windy areas, and so does keeping the house prepared the same way from one test to the next. If the home has a conditioned garage or any adjacent occupied space, make sure the auditor notes how that area was handled so the result isn't misread later.
The point of the second test isn't bragging rights. It's verification. In a humid region, a lower number means less outdoor air is sneaking in, less moisture load for the AC to remove, and a better shot at keeping the building comfortable without overworking the system.
A blower door score is useful, but it isn't sacred. Wind direction, hose placement, pressure averaging, and the setup of the building itself can all move the number enough that a borderline result needs context. That's not a flaw in the method, it's a reason to read the report carefully.
AIVC testing guidance notes that windward-side setup can cause about 3x the error of leeward-side setup, and it recommends longer averaging times when wind exceeds 10 mph, with bias-pressure averaging and multiple 10-second averages emphasized as standard practice, according to AIVC wind testing guidance. That means a slightly better or worse result on a different day might reflect conditions as much as it reflects the home.
The safest way to think about the number is as a decision aid, not a verdict. If the result sits near a target, the next question should be whether the test was done consistently, whether the building was prepared the same way, and whether the leakage paths were identified before anyone started sealing. A borderline score with poor documentation is less useful than a modestly higher score with a clear protocol and a good leak map.
A single number is a snapshot. The report and the setup tell you how sharp that snapshot really is.
The decision framework is straightforward. First, identify CFM50 and ACH50. Second, classify the home as tight, moderate, or leaky. Third, match the sealing material to the leak path, not the other way around. Fourth, re-test so the improvement is verified instead of assumed. In South Florida, that process is especially valuable because the goal isn't only lower energy use, it's better humidity control and a house that feels steady instead of muggy.
If you want help turning a blower door report into a practical sealing plan, visit Airtight Spray Foam Insulation and ask for a free quote. Their team works across South Florida, from Jupiter to Stuart, and can help connect test results to targeted spray foam and air-sealing work that's aimed at comfort, moisture control, and a tighter building envelope.